I have located a number of R Scripts over at my OneDrive account and you can head over there to download them. There are some other goodies over there too, so why not take a look?

how do you open files? To create a new file, you use the File -> New menu.
To open an existing file you use either the File -> Open menu.
Alternatively, you can use the Open Recent menu to select from recently opened files.
If you open several files within RStudio, you can see them as tabs to facilitate quick switching between open documents.
If you have a large number of open documents, you can also navigate between them using the >> icon.
You could also use the tab bar to navigate between files, or the View -> Switch to Tab menu item.
Let’s open the Women file and take a look at the commands.
Comments in R are preceded with a hash symbol, so that is what we are using here.
# this loads the dataset
data(women)
# You can see what is in the dataset
women
# This allows you to see the column names
names(women)
# You can see the output of the height column here, in different ways
women$height
women[,1]
women[seq(1,2),]
women[1:5,1]
women[,2]
# we can start to have a little fun!
# we are going to tell R that we are going to build a model of the data
attach(women)
model
model
print(model)
mode(model)
predict(model, women, interval=”predict”)
newdata = data.frame(height=60)
newdata
predict(model, newdata, interval=”predict”)
women
r
summary(model)
Now we can see some strange output at the bottom of the page:
Call:
lm(formula = weight ~ height)
Residuals:
Min 1Q Median 3Q Max
-1.7333 -1.1333 -0.3833 0.7417 3.1167
Coefficients:
Estimate Std. Error t value Pr(>|t|)
(Intercept) -87.51667 5.93694 -14.74 1.71e-09 ***
height 3.45000 0.09114 37.85 1.09e-14 ***
—
Signif. codes: 0 ‘***’ 0.001 ‘**’ 0.01 ‘*’ 0.05 ‘.’ 0.1 ‘ ’ 1
Residual standard error: 1.525 on 13 degrees of freedom
Multiple R-squared: 0.991, Adjusted R-squared: 0.9903
F-statistic: 1433 on 1 and 13 DF, p-value: 1.091e-14
What does this actually mean? As part of my course, I normally discuss this in detail. For those of you reading online, here is the potted summary:
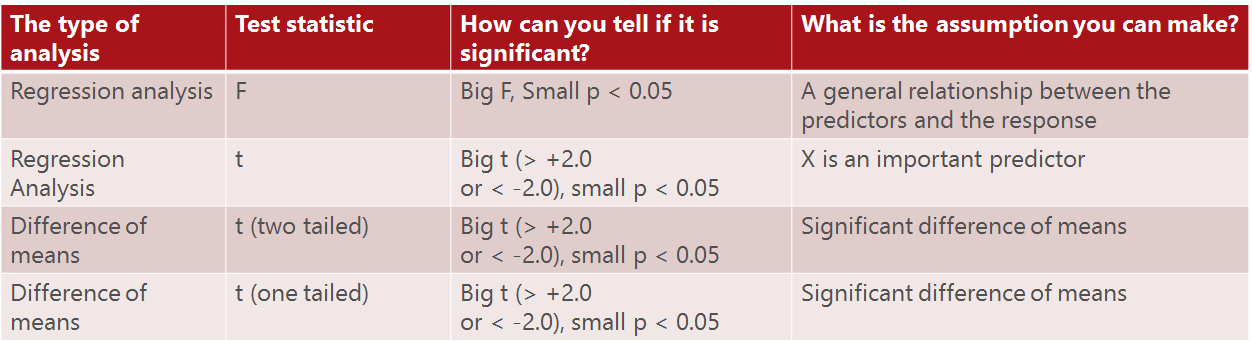
Basically, you want big F, small p, at the 30,000 feet helicopter level. We will start from there, and move down as we go.
The stars are shorthand for significance levels, with the number of asterisks
displayed according to the p-value computed.
*** for high significance and * for low significance.
In this case, *** indicates that there is likely to be a relationship.
Pro Tip
Is the model significant or insignificant? This is the purpose of the F statistic.
Check the F statistic first because if it is not significant, then the model doesn’t matter.
In the next Day, we will look at more commands in R.


